
| ||||||||||||||||||||||||||||||||||||||||||||||||||||||||||||||||||||||||||||||||||||||

Tue 2026-06-16
Mon 2026-06-15
Sun 2026-06-14
Queer Fascism and the End of Gay History Sat 2026-06-13
Fri 2026-06-12
Thu 2026-06-11
Wed 2026-06-10
Mon 2026-06-08
Search
Archives
2024
12 11 10 09 08 07 06 05 04 03 02 01
2023
2022
2021
2020
2019
2018
2017
2016
2015
2014
2013
2012
2011
2010
2009
2008
2007
2006
2005
2004
2003
One good site
MDN
Nelson Minar
Blog licensed under a Creative Commons License
|
I recently went to my doctor for a regular checkup. he ordered some
labwork. Nothing special; basic blood and urine tests to see that I'm
doing OK. Here's the thing: the billing is entirely insane. I
have individual health insurance from Anthem, and the insurance
adjustments are completely incomprehensible. Here's an itemized bill.
My health care provider charged me $400 for the tests. They only got paid $50, an 88% discount, because that's what Athem has negotiated. I paid $15 of that $50. Huh? How do these numbers make sense? In no way is this free market rational pricing. When my mother died, in 2000, she went to the hospital with urgent problems. With no insurance. They operated on her for a few hours, she spent a day in intensive care, and she died. It was pretty fucking awful. It also cost some $50,000, billable to her estate. The hospital gave us a 35% discount for paying the bill in cash. I'm fortunate to be able to afford to buy my own health insurance and healthcare. My family was fortunate that my mother could get the care she needed and the medical bills didn't bankrupt us. In neither case does the pricing make sense. It's particularly bizarre that the primary value of insurance seems to be pre-negotiated lower prices for healthcare. Instead of, you know, insurance.
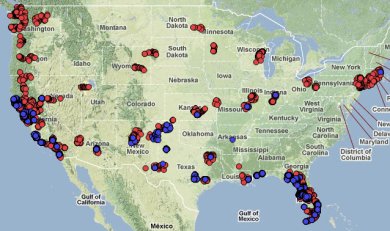
I
like my iPhone tracking where I've been; my only complaint with
Apple is they didn't disclose this useful feature and give me access.
But it's not much hacking to get at the data, so I made a map. Red is
cell phone towers, blue is wifi nodes. The map looks correct to me; I
did a lot of small plane trips in the last year.
On reflection, there's too many points (500+) inside
San Francisco, including some in the water, for this to be just cell
tower locations from Apple's database. Maybe it is my calculated position?
The primary key for the database was named by Apple as MCC+MNC+LAC+CI,
which
apparently
is the "Cell Global Identity". The iPhone only keeps one fix for each;
no idea why some are in the water.
Technical details on my secret work blog. The main thing is two tables called CellLocation and WifiLocation which map tower ID or WiFi MAC to a latitude and longitude. The table's big, some 32,000 cell towers and 170,000 wifi nodes. I wrote some quick code to convert the data into GeoJSON and map it with Polymaps. I'd link the zoomable map, but it's personal data and the code isn't optimized.
Our culture has not yet figured out how to handle privacy in the age of
digital data. We've had a couple of recent reminders that cell phones
are people tracking devices: iPhones
are recording a history of your location and so are cell
phone companies. Both law enforcement and any person with access to
your phone or computer can find out everywhere you've been for the last
year.
The problem is this lack of location privacy surprises people. Telco tracking has been happening for several years now. Here's the thing: I want a record of everywhere I've been. I want access to that data. A big problem with the telco tracking is I don't have access to my own location data; only AT&T and the cops do. The big problem with the new iPhone tracker isn't that the phone is tracking my position, it's that I don't have easy access to that track. A basic law of the digital age is that any information that exists is going to be collected and archived. Once some fact is available, like the location of my cell phone, that data is going to end up in a historical database. Either by design (telco towers) or by accident (iPhone). It's hopeless to stop personal data from being recorded. Instead we need to develop good laws about authorized access to that data. And we need to develop good tools for people to access and use their own data. There's no value in hiding our head in the sand and pretend that iPhones recording location data is some anomaly. Tracking personal data is the inevitable future and it should be made a good and useful thing. PS: American cell phone companies also keep records of all your SMS messages and provide them to the police when subpoenaed. But you can't get a copy of your own SMS history from the telco.
George Eapen reminded me that
Google Latitude is
a solid user-controlled phone tracking product.
I've been on a productivity kick lately, trying to figure out how I
manage so few hours of hacking on my projects and so many hours wasting
time web surfing. I mentioned a failed experiment offloading web
surfing to the iPad. The other thing I've been doing is running time
tracking software, the web based RescueTime and the Windows app TimeSnapper. They're both useful.
Both programs watch what what software you use on your computer during the day and then give you reports of your usage classifying time as productive or non-productive. TimeSnapper's special feature is recording screenshots every 10 seconds and letting you review your day. RescueTime's special feature is community-based classification so that it already knows that github.com is productive time whereas 4chan.com is not. Thanks to these tools I now know (for instance) that I spend nearly an hour a day on Metafilter. Ouch! The virtue and the failing of these tools is they are mostly passive recorders; they are great for monitoring behaviour, not modifying it. A lot of productivity guides suggest some sort of action to say "I am working now"; punching into a time clock, starting a 30 minute timer, etc. That works for me at times but it also makes hacking feel like more of a chore than I would like. (I envy Ben Franklin.) One thing I dislike is the monitors often report bad news. TimeSnapper's primary report is a "Productivity Grade" where some days I rank 20%, 30%: talk about a failure! RescueTime's report shows the average user is "0.52 efficient", not a very auspicious goal. It's just a language problem but it seems important. Another drawback of these tools is privacy: they record every program and website you use. There's ways to mitigate disclosure: temporarily switch monitoring off, encrypt TimeSnapper screenshots, tell RescueTime not to record specific websites. RescueTime has found a market as a tool to let managers snoop on their employees (with disclosure). Useful, but also a bit creepy. My free month of TimeSnapper is up and I won't be paying $25 for it. It's a good tool and the screenshots are nifty and occasionally useful. But it takes a lot of disk space and the reports aren't so useful. I'm going to invest a bit more time (and $6/month) into RescueTime, I think I have more to learn from it.
Google Maps' tiling has become a de-facto standard for Internet maps.
You can see how it works in this
interactive demo. Basically every map tile is named by three
numbers: the zoom level and an X,Y coordinate. For example, most of San
Francisco is contained in tile z=11
327,791. Oregon is in z=5
5,11. Google, Bing, and many open
source tiles use the same tile cuts, albeit with different names.
The maps are based on the spherical
mercator projection EPSG:3857.
How big are the tiles, what scale is the map? The best explanation I've seen is Microsoft's. Tiles are 256x256 pixels (by convention). At Z=0 a single tile covers the whole earth (except the poles). Each progressive zoom level is 1/2 the scale. Tiles are always square, but get smaller the further you are from the equator. Tiles "naturally" get less wide (in meters) because the lines of longitude narrow at the poles. The conformal projection we use for tiles also causes the tiles to get less tall (in meters) so that each tile remains square. I'd love to see a 3d globe with this tile mesh draped on it! Here's a table of map scales for various zoom levels, see also my spreadsheet. "Feature" describes something that will generally fit in a single 256x256 tile. "One pixel" is miles or feet per pixel. All values are calculated at 37N, the latitude of San Francisco. Tiles at the equator are roughly 20% bigger on a side than in San Francisco; at 60N they are roughly 40% smaller.
I'm particularly interested in elevation and terrain tiles. SRTM has global coverage at roughly 90m or z=11. NED 1/3 is US coverage at roughly 10m or z=14. Google's terrain layer provides tiles globally to z=15, but it looks pretty averaged in remote locations. Caveat: I've found a lot of conflicting tables and explanations of map tile scales: it may be I've got something wrong. See also OSM and this discussion. I also ran into an interesting spreadsheet, the time and storage requirements for a tileset (from Geosolutions). The globe to z=12 takes about 3 gigs of disk and a day to render. See also rules
of thumb for geocoordinates
I saw an interesting talk by
Sha Hwang and
Zain Memon of
Trulia, the real estate
data company.
They described a clever way to let a user manipulate a map visualization
interactively in their client. I don't know of a demo to link yet,
so please bear with the prose description.
Say you want to show a heat map of average home price by zip code. The traditional way would be to render a raster image (or tile set) on the server with each zip code coloured by price. Very efficient for the client, but you're stuck with a single visualization. Or you can overlay a bunch of vector polygons on top of a raster map: efficient, manipulable, but you are drawing complex shapes in the browser and it doesn't scale well. A third way they described is rendering the zipcodes into a raster map, then repainting in the client. The basemap tiles don't look like much, a harlequin of colours. Yellow for 94114, red for 94117, black for 94121, etc. Then on the client, Javascript goes in and applies a colour map: turn all 94114 pixels orange (medium expensive), 94117 pixels red (very expensive), etc. The advantage is the colouring happens entirely in the client. The user can easily interact and try out different visualizations (say, convolving with crime rate) without going back to the server for new image tiles. Sha had a great way to describe this idea: in their image tiles, the pixel colours do not represent the data values like price or crime rate. Instead they represent the data keys, the zip code, and then they join that key to various values in the client dynamically. It's a nice generalization of an idea I've seen various folks play around with (myself included). I'm not aware of an online map yet using this technique but Sha said he thought the technique was fast enough to be practical for consumer use. I belive the easiest way to implement it would be using canvas. Unfortunately that's a poor match to the SVG implementations I've been favouring lately, but no doubt there's a way to make it work by embedding canvas elements inside SVG or the like.
Update: Trulia has now placed online a map that
uses this technique. Compare:
server-rendered,
client-rendered.
Inline below is an example zip code tile image.

I did an experiment using my iPad for my two hours of daily reading of
the Internet. It didn't go great, mostly because of UI limitations. But
it's definitely workable.
I've got a daily list of things I read online. RSS feeds in Google Reader, a few community sites like Metafilter and the AOPA forums, Twitter and Facebook, and some random image blogs (notably Chan4Chan NSFW). Doing a full read takes an hour or two and I consider it time well spent. Reading those same sites a second, third, fifth time the same day still takes about an hour and becomes procrastination. So I thought I'd shift that work to my iPad, leave my desktop for real work. The good things.. It's nice having the iPad in your lap in a comfy chair. The touch scrolling and navigation is comfortable for casual reading. The display is beautiful; bright, high enough resolution, and generally fast enough except for the monster chan4chan page. The main bad thing is the single-tasking user interface of iOS. I'm surprised how much multitasking I do when reading the net. Metafilter opens up into a forest of 20 tabs, sometimes several new windows as I explore sidelines. Google Reader URLs get copied and pasted into Delicious for linkblogging. Forum responses get written, sometimes over 30 minutes as I research related things. Videos are watched in the background. Task switching is possible on the iPad but it's awkward. App switching is clumsy and cut and paste is a real chore. In general I like the idea of single-tasking interface. But my random daily reading is something that seems best suited to a multitasking windowed UI. What I really need is to be able to write code on my iPad. Only that too is multitasking: an editor, the software itself, docs, version control. The iPad is best at single task focus, like games or videos or books. (Related: I have a Kindle for sale.) It also seems to work better with new custom apps like Reeder or Twitter; traditional web sites like Metafilter don't quite fit the iPad as well.  The La Cross
BC-9009 Battery Charger is good hardware. Nothing fancy, just
charges AA and AAA batteries. But it's really good at charging. You can
choose low current if you're not in a hurry and want to extend battery
life or use high current for a quick charge. It has a mode where it
discharges the battery first as well as a reconditioning mode that
cycles the battery a few times. It's $46 on
Amazon.
The La Cross
BC-9009 Battery Charger is good hardware. Nothing fancy, just
charges AA and AAA batteries. But it's really good at charging. You can
choose low current if you're not in a hurry and want to extend battery
life or use high current for a quick charge. It has a mode where it
discharges the battery first as well as a reconditioning mode that
cycles the battery a few times. It's $46 on
Amazon.
We use Eneloop NiMH batteries; they seem well rated. I'd love to use lithium batteries but there are few options for rechargeables; NiMH is more of a developed market. I used to never bother with rechargeable batteries but we go through enough batteries in the airplane it's worth it. A hidden benefit is you can replace the batteries in your device whenever you feel like it; no need to risk running flat because you're trying to get every last milliamp out of your disposables. |
|||||||||||||||||||||||||||||||||||||||||||||||||||||||||||||||||||||||||||||||||||||
