
| ||

Tue 2026-06-16
Mon 2026-06-15
Sun 2026-06-14
Queer Fascism and the End of Gay History Sat 2026-06-13
Fri 2026-06-12
Thu 2026-06-11
Wed 2026-06-10
Mon 2026-06-08
Search
Archives
2024
12 11 10 09 08 07 06 05 04 03 02 01
2023
2022
2021
2020
2019
2018
2017
2016
2015
2014
2013
2012
2011
2010
2009
2008
2007
2006
2005
2004
2003
One good site
MDN
Nelson Minar
Blog licensed under a Creative Commons License
|
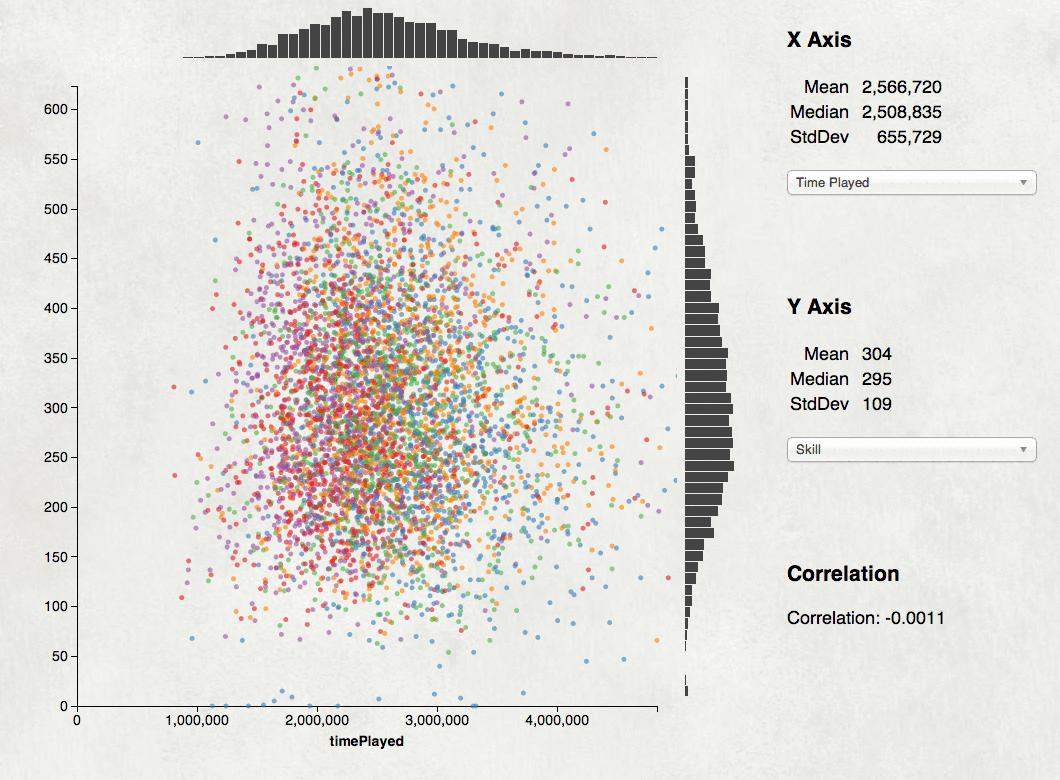
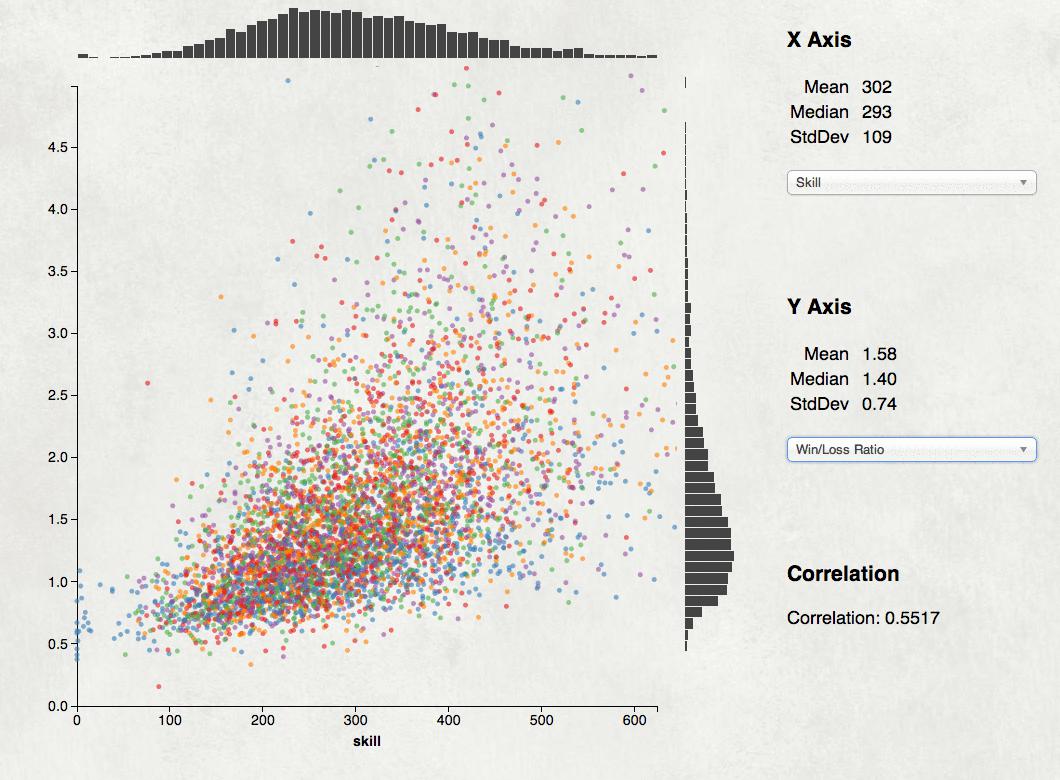
Just finished another game visualization project, graphs of stats for the top 5000 BF4 players. It makes scatterplots for the player population of statistics like skill score vs time played, win/loss ratio vs. skill, and kill/death vs. win/loss. Lots of details in this Reddit post. 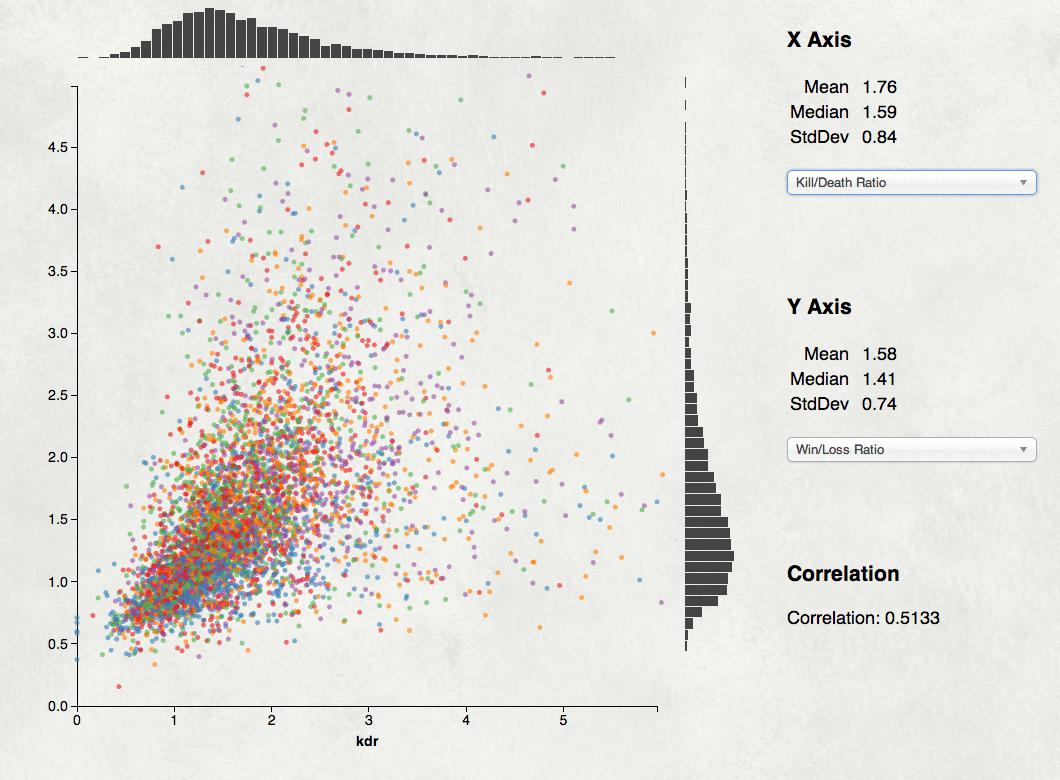 Another fun D3 project; scrape a bunch of data, cook it into a 2 megabyte CSV file, then do custom visualizations. I like the way the scatterplot came out and may re-mix it as a generic data exploration tool, a sort of GGobi lite in your web browser. Drop a CSV file into your browser window and get a simple tool for exploring it for correlations. It’s frustrating trying to get attention for projects like this. All I know to do is post it to the relevant subreddit and hope for the up-votes, but that’s pretty random. My Reddit attempt for the LoL lag tool failed, and a site I worked about 50 hours on has had a total of a few hundred visitors after a week. Discouraging. |
|
