
| ||

Fri 2026-05-15
Thu 2026-05-14
Tue 2026-05-12
Sun 2026-05-10
Fri 2026-05-08
Kyle Kingsbury Podcast Podcast Mon 2026-05-04
Sun 2026-05-03
Fri 2026-05-01
Thu 2026-04-30
Wed 2026-04-29
Tue 2026-04-28
Search
Archives
2024
12 11 10 09 08 07 06 05 04 03 02 01
2023
2022
2021
2020
2019
2018
2017
2016
2015
2014
2013
2012
2011
2010
2009
2008
2007
2006
2005
2004
2003
One good site
MDN
Nelson Minar
Blog licensed under a Creative Commons License
|
One of my favorite map visualizations is Ben Fry’s ZipDecode, a 2004 project that shows the hierarchical nature of zip codes with a simple interaction. I wanted to play with it and was frustrated at how hard it was to run a Java applet these days. So I rewrote it: ZipDecode in Javascript. 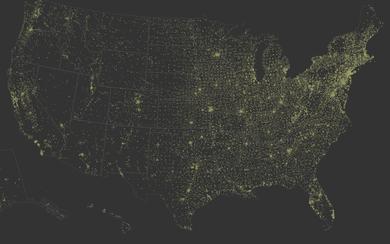 Well I rewrote the easy parts. I left out the zoom, although that would be pretty straightforward using D3 transitions. And I left out the color transitions; the simple way I’m doing this in SVG it’s too slow to animate. I should rewrite it using Canvas to match the speed of the 2004 Java applet. D3 makes this kind of visualization very easy. Particularly the projection; Ben’s online example uses a janky Platte Carrée, I imagine because he didn’t want to do the math. (The version in his book is more georesponsible.) I don’t want to do the math either, but with D3 I can just use the provided AlbersUSA. The source is on GitHub and is quite readable, I think. |
|
