
| ||
Tue 2026-05-12
Sun 2026-05-10
Fri 2026-05-08
Kyle Kingsbury Podcast Podcast Mon 2026-05-04
Sun 2026-05-03
Fri 2026-05-01
Thu 2026-04-30
Wed 2026-04-29
Tue 2026-04-28
Mon 2026-04-27
Sun 2026-04-26
Search
Archives
2024
12 11 10 09 08 07 06 05 04 03 02 01
2023
2022
2021
2020
2019
2018
2017
2016
2015
2014
2013
2012
2011
2010
2009
2008
2007
2006
2005
2004
2003
One good site
MDN
Nelson Minar
Blog licensed under a Creative Commons License
|
 I've been noodling around with doing weblog stats using the
Python
interface to gdchart. I'd forgotten how much fun scripting
languages can be. I can lay down a lot of sloppy code quickly and get
the information I need. So much simpler that the burden of Software
Architecture!
I've been noodling around with doing weblog stats using the
Python
interface to gdchart. I'd forgotten how much fun scripting
languages can be. I can lay down a lot of sloppy code quickly and get
the information I need. So much simpler that the burden of Software
Architecture!
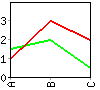
gdchart is good software; simple code to draw graphs and save them as GIF or PNG files. The Python interface makes it really easy to do some serious charting.
gdchart.chart(gdchart.GDC_LINE, (450, 250),
outputBase + ".png", [time.strftime("%m/%d", time.localtime(day[0])) for day in dispReaders], [day[1][0] for day in dispReaders], [len(day[1][1]) for day in dispReaders], [day[1][2] for day in dispReaders], [len(day[1][3]) for day in dispReaders]) |
|
